
In this article, we will be discussing how to use Time Series Anomaly Detection in Azure Machine Learning and this article comes next in the Azure Machine Learning series. During this article series on Azure Machine Learning, we have discussed multiple machine learning techniques such as Regression analysis, Classification Analysis and Clustering. Further, we have discussed the basic cleaning techniques, feature selection techniques and Principal component analysis, Comparing Models and Cross-Validation and Hyper Tune parameters until today in this article series.
What is a Time Series?
Time series means that you have data set in which you have date-time attributes and continuous attributes such as amount, rainfall, etc. With the expansion of IoT devices, you will see a lot of time series data in action today. There are a large number of components in a Time Series as discussed in this blog posts and due to this complexity, time series analysis is a much more complex analysis. Due to the large volume of data and higher velocity of data, there are more chances that there are a lot of errors in the time-series data. Due to the large data errors, it is important to perform Time Series Anomaly Detection before performing any insight into the data.
In the world of Azure, there are three different tools for Time Series. You have the Azure Time Series Insight to analysis time series with different groups. In the Azure Machine Learning Services, you have the option of performing time series forecasting. In the Azure Machine learning portal, you have the control called Time Series Anomaly Detection to carry out anomaly detections in Time Series.
Data Set
As we have been working with the Adventureworks data set for most of the examples in the article series, this time we need a data set with a data time attribute. This time, let us look at the COVID-19 data set from https://data.world/shad/covid-19-time-series-data. You can download a data set and upload it to the Azure Machine learning portal as we did in the very first article. We will be using the COVID-19 confirmed cases dataset to demonstrate the features of the Time Series Anomaly Detection control in Azure Machine Learning.
In this data set, there are three attributes, country, total, and date. By introducing a Summarize Data control you can look at the properties of the selected dataset. It shows that there are 70,272 records for 192 countries over a year.
Time Series Anomaly Detection
Now let’s see, how we can incorporate the new control. To find out the anomalies, this control needs a unique data value. In this dataset, the date column is unique for each country. Therefore, either you need to filter a time series for a month or you need to aggregate the data for the date by using Apply SQL Transformation control.
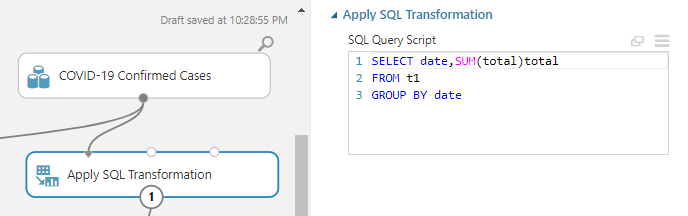
In this control, data can be aggregated by placing the above query. Now, data is aggregated for each date. Next, we need to include the Time Series Anomaly Detection control in order to find the anomalies in the time series.
To find out the time series anomalies, there are a few configurations to be done for the selected control as shown in the below figure.
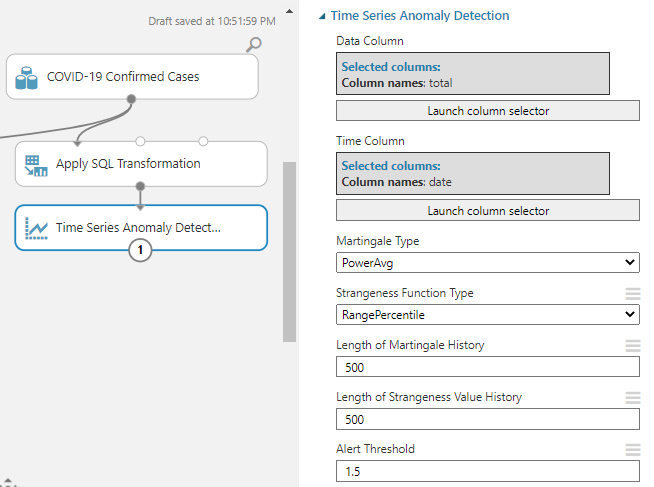
Out of those configurations, you need to select the time and date column of the time series. In this scenario, those two columns are date, total respectively. In some cases, you may have to change the data type of the date attribute by using the Edit Metadata control.
The next five parameters are to identify the anomalies in the selected time series. There can be mainly two types of anomalies that is the trend and the value. Martingale type is used to identify the value anomalies while Strangeness Function Type is used to identify the trend anomalies.
|
Parameter |
Option |
Description |
|
Martingale Type |
PowerAvg |
This will work for most of the time series which is the default value. |
|
Power |
Alone with the Epsilon parameter, you can define the sensitivity. |
|
|
Strangeness Function Type |
RangePercentile |
The default and the most common option. |
|
SlowPosTrend |
To identify the positive trend changes |
|
|
SlowNegTrend |
To identify the negative trend changes |
For both parameters, you can provide the value that defines how many historical values it should check for. Though the default value is 500, you have the option of specifying a value between 0 – 5000.
Alert thresh hold is used to define what is the threshold value that should be identified as an anomaly. The default value is 3.25 and you can specify a value between 0-100.
After configuring the Time Series Anomaly Detection as mentioned above, now you are ready to execute the experiment and you will get the following results from the Time Series Anomaly Detection control.
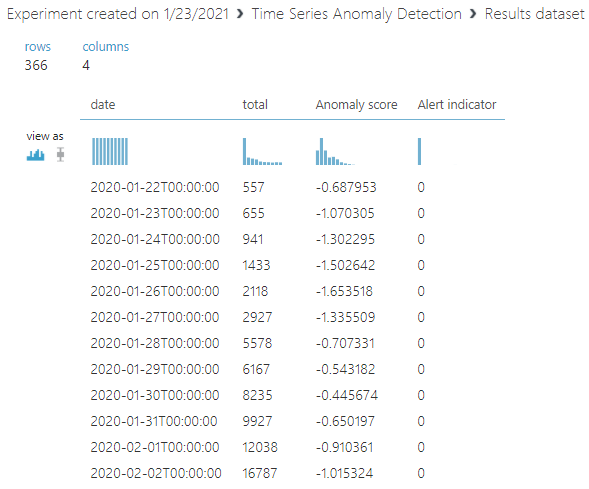
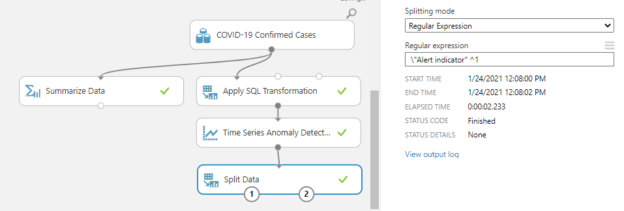
You will see that two additional attributes are added to the data stream namely, Anomaly Score and Alert indicator. Now let us use a Split data control to identify the anomaly using the Regular Expression splitting mode.
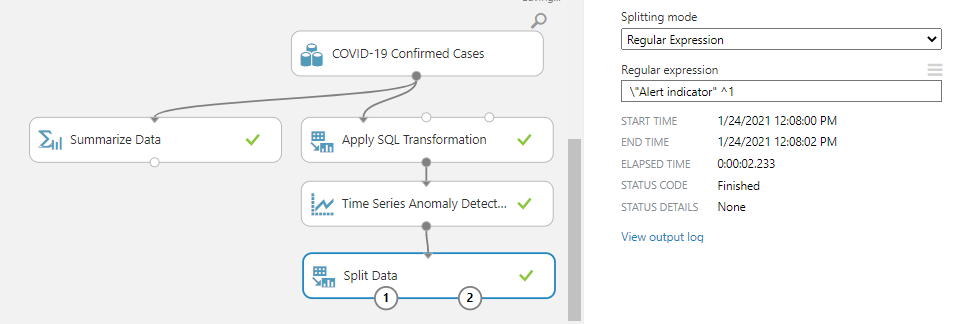
This configuration will give the output of anomalies in the input time series.
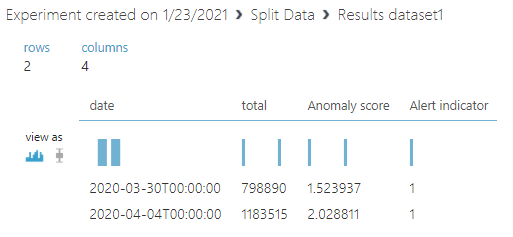
As shown in the above figure, the control has identified two anomalies.
Anomaly Replacement
Though the identification of anomalies is an important task, it is also important to replace anomalies with correct values. There are several ways of replacing the anomaly values.
- Replace with a constant
- Replace with a mean/mode, .etc
- Replace with previous values
- Replace with the weighted average of previous and after values
Let us look at how we can replace the anomalies with the weighted average of previous and after values in the same experiment.
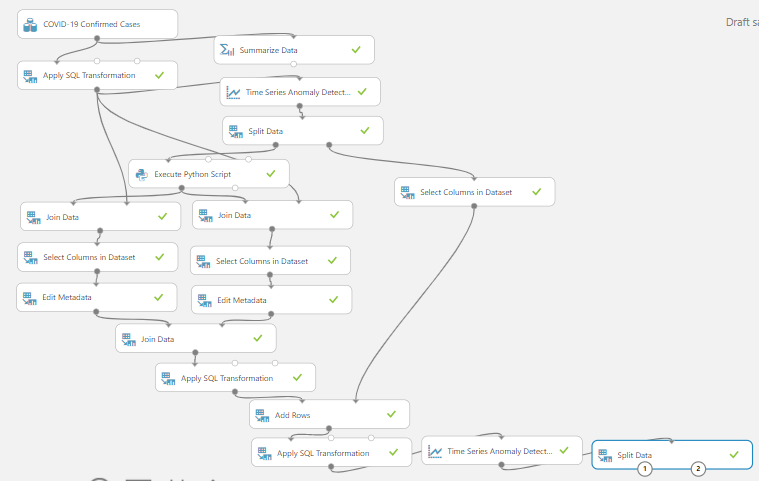
As you can see from the above figure, it is somewhat complex, but we will look at step by step. However, this experiment is published for the public and it is available at https://gallery.azure.ai/Experiment/Time-Series-Anomaly-Detection-3
Step 1: Find previous and next days
We will be using Execute Python Script to find the previous and next days with the following python script.
|
1 2 3 4 5 6 7 8 |
import pandas as pd import datetime def azureml_main(dataframe1 = None, dataframe2 = None): theday = dataframe1["date"] dataframe1["preday"] = theday - datetime.timedelta(days=1) dataframe1["futday"] = theday + datetime.timedelta(days=1) return dataframe1, |
Then two Join Data controls are used to join the previous and the next date with the aggregated data sets. Select Columns in Dataset and Edit Metadata is used to select the data and rename the columns respectively.
Step 2: Applying weightage Average of Previous and Next values
Both data sets were joined with the dates so that previous and next values in a row as shown below.
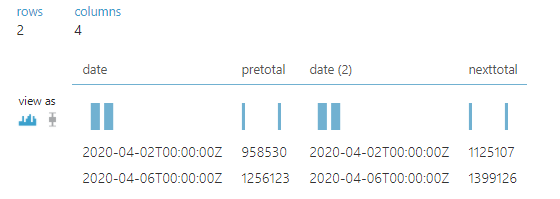
Next, we want to generate the weightage average for the pretotal and nexttotal attributes using the following script using the Apply SQL Transformation control
|
1 2 3 |
SELECT date, (pretotal * 75 / 100 ) + ( 25 * nexttotal / 100 ) AS total FROM t1 |
If you want to replace the anomaly value with the previous or next values without adding any weightage average, you can simply include the weightage as zero to the unwanted component. After the weightage average is calculated, then we will add the non-anomaly data set again to perform the Time Series Anomaly Detection. You will see that one of the anomaly records is eliminated and still one record exits.
Conclusion
In this article, we looked at another Azure Machine Learning Control named Time Series Anomaly Detection. Since time series is a very complex dataset, there can be a lot of anomalies data in the tome series. Using different parameters, we can identify anomaly data in the time series. Further, we have extended the Azure Machine Learning experiment to replace the anomalies with the weightage average of the previous and next values.
Further References
- https://gallery.azure.ai/Experiment/Time-Series-Anomaly-Detection-3
- https://docs.microsoft.com/en-us/archive/msdn-magazine/2017/november/machine-learning-azure-machine-learning-time-series-analysis-for-anomaly-detection
- https://docs.microsoft.com/en-us/azure/machine-learning/studio-module-reference/time-series-anomaly-detection
- https://docs.microsoft.com/en-gb/archive/blogs/machinelearning/anomaly-detection-using-machine-learning-to-detect-abnormalities-in-time-series-data
Table of contents

View all posts by Dinesh Asanka
- Testing Type 2 Slowly Changing Dimensions in a Data Warehouse - May 30, 2022
- Incremental Data Extraction for ETL using Database Snapshots - January 10, 2022
- Use Replication to improve the ETL process in SQL Server - November 4, 2021